Your web browser is out of date. Update your browser for more security, speed and the best experience on this site.
Flying lab
Quantifying emissions from hard to reach places ? Sampling of large surfaces ? Our flying lab offers the solution.

Our expert in Flying Lab
Emissions determination of surface sources or hard-to-reach sources
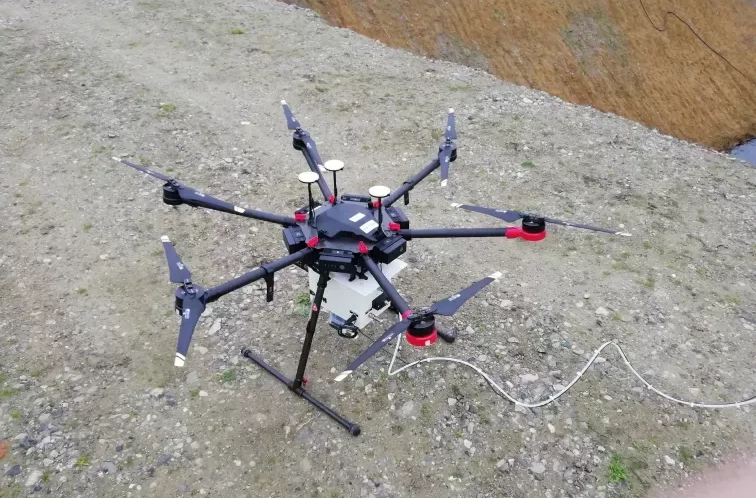
OLFASCAN has a flying lab to perform air quality measurements and to detect, measure and map diffuse emissions. By using electrochemical sensors, accurate and precise measurements are executed in locations that are difficult to access. In addition, the flying lab will be used to quickly screen diffuse emissions from large surfaces. These measurements make it possible to search for patterns and hotspots in order to perform more detailed measurements at the selected locations in a next phase.
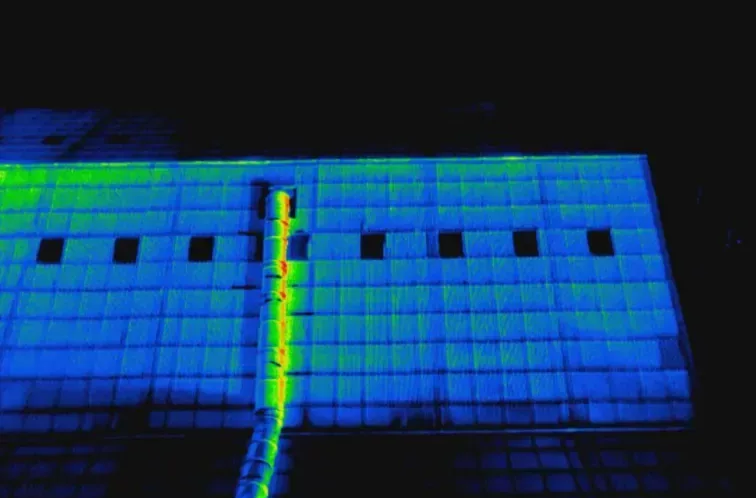
Locating leaks
By means of drone measurements, OLFASCAN can visualise possible leakage flows in various buildings and installations. Here, a thermographic camera is used to detect heat gradients. If leakage currents are present, these will be visualized as heat losses. These images can be viewed live during the drone flight to determine leakage currents on the spot and make it possible to react very quickly.
How can we help
Would you like additional information? Or do you have a specific question for one of our employees? Then be sure to contact us via our contact page.